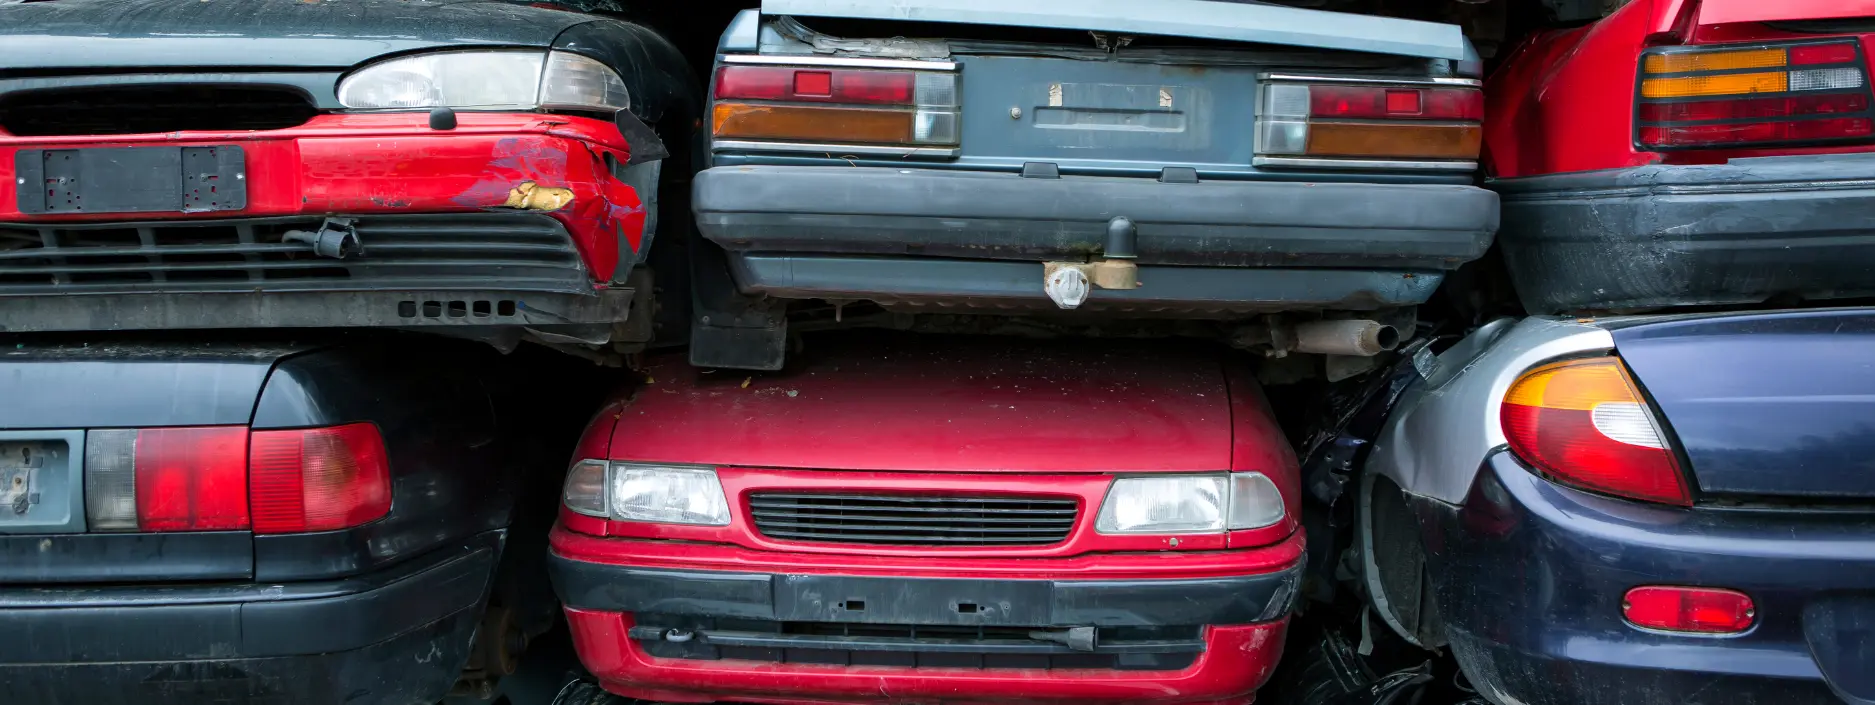
Why Do People Scrap Their Vehicles?
There comes a point when every car owner will decide that their car has done its time with them, whether it’s coming to the end of its life due to age, mileage and becoming increasingly unreliable, or is being replaced by something newer or more suited to the owner’s needs.

It’s natural that anyone would want to get the best pay out for their vehicle when they move it on, which may often be in the form of selling it privately, to a dealership, perhaps as a part exchange for a newer vehicle, or to a car-buying service provider. However, if a car is near the end of its life and the maintenance or repair costs are at a point that’s higher than its sale value, sending a car to scrap or for salvage may be the most cost-effective option.
The price quoted for any scrap vehicles is purely based on the weight and parts of the model, regardless of whether the vehicle itself is fully functional, so owners may be able to get a better price for the vehicle than they may expect.
The following issues are among those that are most likely to send a car to the scrap heap according to our experts:
- Engine issues
- Gearbox issues
- Excessive rust
- Mould or water damage
- Serious electrical issues
- Collision damage
However, Matt Clamp, Car Scrappage Expert here at Scrap Car Comparison explains that damage can also be a leading reason for a car heading to scrap: “The cost of repairs outweighing the value of a vehicle is a primary reason why cars end up on the scrap heap, but these repairs can come from damage sustained in a crash as well as from wear and tear with high age or mileage. Flood water is another way that a car can sustain damage of this level – with our winters in the UK wetter than ever, many locations are now flooding much more frequently, or for the first time, which can catch car owners out if their vehicle is parked in these areas.”
For those who simply want to move their car on quickly, scrapping or sending a car to salvage can be a more effective option than selling, as the process is much more convenient and straightforward for the owner – there’s no need to give the car a deep clean, take time to snap appealing photos for an advert or spend time haggling with potential buyers. Many people may often think that scrapping is only for cars that are no longer functional, but it is often done with fully working cars as a result of the time saved too.
In the case of fully functioning vehicles, scrappage schemes such as that introduced by the Mayor of London are now frequently utilised by those who may live in an Ultra Low Emission Zone (ULEZ), as they offer the chance for car owners to scrap their non-ULEZ compliant vehicles in return for grants that would help them to switch to cleaner modes of transport instead.
If you feel like your vehicle could fall under one of the reasons outlined above, or you want to find out more about when scrapping could be the best way to move on your vehicle, we have a blog post on the topic that could help you find out more.
What Cars Get Scrapped The Most?
- Vauxhall Astra takes top spot away from Ford Focus
- Vauxhall and Ford continue to be most scrapped makes, with Peugeot joining the top three for the first time
- Average mileage of a scrap car is 131,700, up almost 10,000 miles year-on-year
- The average age of a scrap car now sits at 17 years and three months.
As has become the norm here at Scrap Car Comparison, we’re not happy with just looking at the top-line figures and have trawled through the figures to see any trends we can find. We’ve looked into every vehicle our team has helped scrap in the past 12 months, and broken it down into top ten tables for both makes and models compared to the same statistics in 2024. Alongside this, we’ve also looked at how many miles the cars covered and how long they spent on the road in general.
The Average Mileage of a Scrap Car
As cars get more reliable, it’s no surprise that they’re lasting longer than they used to, which we can see from the odometers on the cars we’ve scrapped throughout the year. 2024 saw an average mileage of 123,359 miles, whereas in 12 months that average has increased to 131,700 miles. That’s the equivalent of 163 return trips from London to Edinburgh.
We’ve actually seen some cars with much higher miles on the clock, but this final average figure is, of course, brought down by some cars needing scrapping following accident damage before they’ve driven themselves into the ground. The longer a car drives, the more likely the need for major maintenance work. Some components have a known shelf life, such as cambelts that should really be replaced at the 60,000 mile stage, while the likes of your brake pads, gearbox and engine should be closely monitored as the miles rack up.
The way a car drives can also largely impact the number of miles it’s able to achieve before its final trip to the scrap pile. Endless long-distance motorway trips might seem like they’ll be putting more strain on an engine, but actually the constant steady RPM of motorway miles can be good for the inner gubbins. The engine also operates at its correct temperature and there are less heavy braking requirements, too. City and short-distance driving, however, puts much more strain on the brakes, clutch and gearbox with the engine rarely making it up to its full operating temperature.
Matt Clamp says: “Over the last decade we’ve seen significant improvements in the durability of engines, corrosion resistance, and onboard diagnostics, all of which help cars stay on the road for longer. We’re also seeing a number of people driving much less since COVID, as the increase of remote working has resulted in fewer commuting miles a year as a result.
Owners are also keeping vehicles longer due to higher new-car prices and greater confidence in long-term reliability. If you were to only consider cars scrapped purely due to age or mechanical fatigue, it’s common to see odometer readings well beyond 150k–180k miles, especially for diesels and Japanese-built petrol engines.”
The Average Age of a Scrap Car
While mileage is usually a good barometer of when to consider scrapping a car, its age is also something you should keep a close eye on. Of course a well maintained car should keep running and running (otherwise there’d be no classic car industry), but the general rule of thumb is that a car that’s over 10 years old is officially “old”. This isn’t a hard and fast rule, though, and will change between makes and models, depending on the build quality, reliability and how they’re driven.
This does again track with our data as the average age of a scrap car remains at 17 years old. What does that mean for you? Well, if you’ve got a car that was built in 2008, then there’s a chance you’ll be requiring our services in the coming months. As with everything, this is just the average, and we’ve seen cars scrapped from 1973 all the way up to brand new 2025 models.
The Most Scrapped Car Models
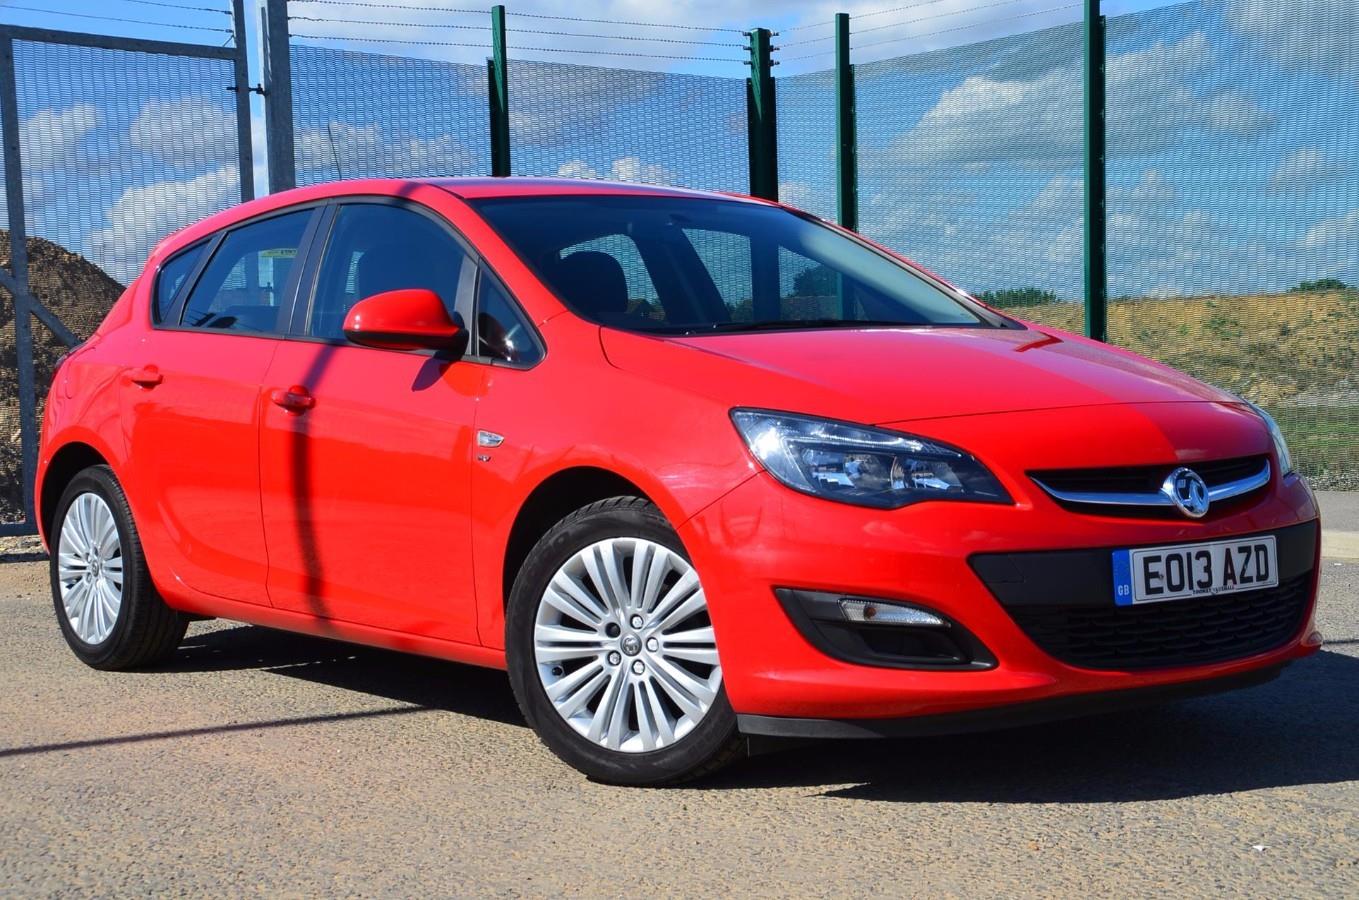
While we’ve been tracking the age and how far our customers’ cars have gone, we’ve also been keeping a tally of every single vehicle that comes through our system. This has been a fairly standard top five for the last few years, and the Ford Focus has sat at the top spot since we started producing this list in 2018. That’s all changed this year, though, as the Vauxhall Astra tops the table for the very first time, accounting for 6% of all of the vehicles we scrapped in 2025.
| Model | Scrap Market Share | Change from 2024 | Average Mileage |
| Vauxhall Astra | 6.0% | +1 | 127,648 |
| Ford Focus | 5.6% | -1 | 130,813 |
| Vauxhall Corsa | 4.8% | = | 108,476 |
| Ford Fiesta | 4.0% | = | 119,965 |
| Volkswagen Golf | 2.8% | = | 151,083 |
| Peugeot 207 | 2.5% | +3 | 107,322 |
| Vauxhall Zafira | 2.2% | = | 129,331 |
| Renault Clio | 2.1% | -2 | 109,323 |
| Mini Hatch (Cooper/One) | 2.1% | -1 | 117,366 |
| Ford Transit | 1.9% | New | 167,157 |
Other than the Astra switching places with the Focus in the top spot, the top five remained largely unchanged from previous years. Sixth place is where it all changes, however. The Peugeot 207, which made its debut in the top 10 last year, jumps up to sixth, rocking up three positions on its ninth place in 2024. Its predecessor, the 206, was a regular in our lists from 2018 to 2021. The 207 jumping up to six sees the Renault Clio and the MINI dropping down as a result, while the Zafira holds firm at number seven. The Ford Transit took tenth, having missed out on any positions in 2024, with the Volkswagen Polo dropping out of the top ten to make way for the famous van.
The Most Scrapped Car Makes
As well as looking at figures by car model, we also have a look at which brands are regularly visiting the scrap pile. Considering the Astra, Corsa and Zafira are all firmly in the top ten, it’s no surprise to see Vauxhall at the top of the charts.
| Manufacturer | Scrap Market Share | Change from 2024 | Average Mileage |
| Vauxhall | 18.5% | = | 124,476 |
| Ford | 16.5% | = | 134,070 |
| Peugeot | 7.7% | +1 | 120,245 |
| Volkswagen | 7.0% | -1 | 148,598 |
| Renault | 5.5% | = | 122,510 |
| Citroen | 4.8% | = | 128,546 |
| Nissan | 3.8% | = | 127,084 |
| Toyota | 3.5% | New | 140,205 |
| Honda | 3.5% | = | 145,398 |
| BMW | 2.5% | -2 | 155,005 |
Vauxhall sitting at the top with an 18.5% market share of scrapped vehicles sees it beat Ford to number one for the second year running. Peugeot jumps up to third, helped by the 207’s position in the model table, but sits a massive 8.8 percentage points behind Ford, showing just how much Vauxhall and Ford are the biggest players when it comes to scrap vehicles.
Volkswagen drops to fourth after swapping spaces with Peugeot, before Renault and Citroen hold on to fifth and sixth respectively. A trio of Japanese vehicles, known for their reliability, come next, with Toyota reappearing in our table for the first time since 2022. Toyota’s arrival also makes good reading for fans of German vehicles, as BMW drops to tenth, and Audi drops out of the top ten altogether.
What Cars Get Salvaged The Most?
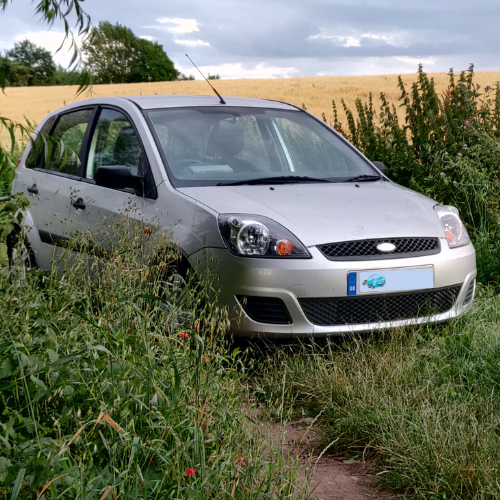
- Ford Fiesta and Ford Focus are the most salvaged cars, with the Vauxhall Corsa dropping from first to third.
- Ford and Vauxhall also top the most salvaged makes list, while Japanese cars rise up the order in 2025.
- Average mileage of a salvage car is 103,286, nearly 30,000 fewer than scrap vehicles.
- Average age of a salvage car is 12 years and 3 months.
Most Salvaged Car Models
While the Vauxhall Corsa became the most scrapped car of the year for the first time, it has dropped out of the top spot when it comes to the salvage rankings.
| Model | Salvage Market Share | Change from 2024 |
| Ford Fiesta | 4.7% | +1 |
| Ford Focus | 4.6% | +1 |
| Vauxhall Corsa | 2.6% | -2 |
| Volkswagen Polo | 2.4% | New |
| Nissan Qashqai | 2.4% | New |
| BMW 3 Series | 2.3% | -1 |
| Volkswagen Golf | 2.0% | -3 |
| Vauxhall Astra | 1.9% | -2 |
| BMW 1 Series | 1.4% | +1 |
| Nissan Juke | 1.4% | New |
Our previous most salvaged car, the Corsa now sits third, having been beaten by the Ford Fiesta and Ford Focus. It was a close run thing at the top of the table, with the Fiesta coming home with 0.1% more market share than its Ford stablemate.
The remainder of the top five is filled with newcomers, including the Volkswagen Polo, which ironically dropped out of the most scrapped top ten this year. The Nissan Qashqai is also a new entry, with the Japanese SUV filling the fifth position. Another Nissan SUV also joined the ranks of salvage vehicles this year, with the Juke squeezing in at number ten.
With the Polo and Qashqai jumping straight in at four and five, the BMW 3-Series, Volkswagen Golf and Vauxhall Astra have all fallen down the order slightly, while the BMW 1-Series rises from tenth to ninth over the past 12 months. Making way for the three new entries were the Ford Transit, Vauxhall Insignia and Audi A3, which previously held seventh, eighth and ninth respectively.
Most Salvaged Car Manufacturers
With the Focus and Fiesta holding the top spot in the most salvaged models list, it’s no surprise to see that Ford has retained its position at the top of our salvage tables in 2025.
| Manufacturer | Salvage Market Share | Change from 2024 |
| Ford | 15.7% | = |
| Vauxhall | 8.7% | = |
| Volkswagen | 7.7% | = |
| Nissan | 6.2% | +3 |
| BMW | 5.9% | -1 |
| Peugeot | 4.8% | -1 |
| Mercedes | 4.5% | -1 |
| Toyota | 4.4% | +2 |
| Citroen | 4.3% | = |
| Audi | 4.0% | -4 |
This is another table that’s seen very little movement at the top of the pile, and in fact is the only one of our four key tables that has seen no new entries for 2025.
Ford, Vauxhall and Volkswagen have held firm in the top three positions when it comes to salvaging in 2025. With the Qashqai and Juke entering the top ten for makes, it’s no surprise to see Nissan jump up three positions from seventh up to fourth. BMW, Peugeot and Mercedes have all dropped down one position each to account for Nissan’s rise.
Toyota jumps up to eighth, up two from tenth last year, while Citroen holds its ninth place once again. Audi drops down the most of anyone in this table, dropping down to tenth compared to its sixth position in 2024.
Value Of A Scrap Car
- Land Rover tops the value tables, getting values 56% higher than the average value across the board
- Smart cars are at the other end of the scale, selling at 40% lower than the national average for a scrap vehicle.
- Highest price scrap – £581 Range Rover TDV8 Vogue 2717kg
- Highest price salvage

The Most And Least Valuable Brands
We’ve often explained on this website that scrap offers are linked to the weight of your car as you’re effectively selling a large lump of scrap metal. This is backed up perfectly by the table below outlining the vehicle manufacturers with higher-than-average scrap offers. Land Rover and Jeep, two of the largest and heaviest vehicles you can buy, top the table. Land Rover pulls in over 50% more than the average price for a scrap car.
The list even sees a name holding on to the past, and also confirming the average age statistic, too. Saab stopped selling cars in the United Kingdom in 2011, so we could, in theory, still see them appearing in our scrapping statistics for the next few years to come. The rest of the top ten is made up of brands known for their executive saloons and larger SUV type vehicles such as BMW, Mercedes, Volvo and Audi. These brands are also known to be slightly more premium, which is a stark contrast to the least valuable list still to come.
Highest Average Scrap Offers by Manufacturer
| Manufacturer | Average Scrap Offer | Variance to Average |
| Land Rover | £283 | +56% |
| Jeep | £259 | +43% |
| Chrysler | £236 | +30% |
| Jaguar | £223 | +23% |
| BMW | £212 | +17% |
| Saab | £211 | +16% |
| Mercedes | £210 | +16% |
| Volvo | £206 | +14% |
| Audi | £199 | +10% |
| Kia | £198 | +9% |
If bigger cars get more money as scrap, then the theory would also suggest that smaller cars get smaller offers. Well, the list below would equally back that up too. Smart cars only get, on average, £100 as a scrap car, which is a mammoth 45% lower than the average price of a scrap car in 2025. A car known for its diminutive stature, it’s no surprise to see it firmly in first place in our rankings.
The rest of the top five is full of other manufacturers known for their smaller nature. The Suzuki Swift, Fiat 500, Chevrolet Spark and the Mini all play their part in bringing their manufacturer up the ranks in the low-value scrap market.
While Saab provides the blast-from-the-past in the higher value rankings, Rover still holds a place in our lower-than-average top ten despite not having a piece of the UK market for 20 years. The iconic British marque was discontinued in 2005, and provides an anomaly in our data considering the youngest Rover is now three years older than the average age of a scrap car in 2025.
Lowest Average Scrap Offers by Manufacturer
| Manufacturer | Average Scrap Offer | Variance to Average |
| Smart | £100 | -45% |
| Suzuki | £140 | -23% |
| Fiat | £141 | -22% |
| Chevrolet | £154 | -15% |
| Mini | £157 | -13% |
| Rover | £165 | -9% |
| Seat | £167 | -8% |
| MG | £168 | -8% |
| Citroen | £168 | -7% |
| Nissan | £168 | -7% |
Average Age of Vehicles Scrapped by Manufacturer
As we’ve previously mentioned, the fact that Rovers are being scrapped enough to enter our top ten tables of scrap values suggests that they’re getting on a bit now. The youngest Rover that would have been able to be scrapped in 2025 would have been 20, given the brand was discontinued in 2005. Two more dead(ish) brands appear in the list below, outlining the average age of scrap cars by manufacturer. Saab once again comes up, having disappeared from the UK in 2011, while MG also crops up with an average age of over 20 years.
MG is a bit of an anomaly, as the vast majority of the cars scrapped here will be over 20 years old, given the British brand disappeared at the same time as Rover in 2005. However, since 2006 there have been numerous new models under Chinese ownership, which has brought the average age down slightly.
We can also take from this data that if you’re looking for a reliable workhorse, a Jaguar or Land Rover is a surprisingly good choice, which goes against the stereotypical nature of the brands’ reputations. Toyota, Volvo, Volkswagen and Honda are perhaps unsurprising additions, regularly appearing as ‘sensible’ options when searching for a new car.
| Manufacturer | Average Age | Variance to Average |
| Rover | 22.9 years | +33% |
| MG | 20.9 years | +21% |
| Mercedes | 19.1 years | +11% |
| Jaguar | 19 years | +10% |
| Land Rover | 19 years | +10% |
| Saab | 18.9 years | +9% |
| Toyota | 18.9 years | +9% |
| Volvo | 18.8 years | +9% |
| Volkswagen | 18.7 years | +8% |
| Honda | 18.6 years | +8% |
Where In The UK Gets The Best Mileage?
A new addition to our datasets for 2025, we’ve looked across the nation to see where cars are likely to survive longest, based on their mileage count. This data is found by taking the postcode in which the quote was generated, and each location required at least 100 entries to be counted as a reliable data source.
Unsurprisingly, London appears highly in our list of those with the worst mileage, accounting for eight out of the ten entries. Kirkcaldy and Kilmarnock fill the remaining two positions, suggesting that Scotland is the second worst place for vehicle longevity after the capital city.

Worst Average Mileage By Region (Scrapped Cars)
| Region | Average Mileage | Variance to Average |
| Twickenham | 113,493 | -14% |
| South West London | 113,992 | -13% |
| Bromley | 115,087 | -13% |
| Kilmarnock | 115,852 | -12% |
| North London | 117,194 | -11% |
| South East London | 117,659 | -11% |
| Croydon | 118,571 | -10% |
| Kirkcaldy | 119,560 | -9% |
| Dartford | 120,118 | -9% |
| North West London | 120,348 | -9% |
With regards to getting higher than average mileage, there seems to be no real theory as to where’s best to move to. Our data suggests that there are plenty of places around the country where cars will drive further before being scrapped than the national average.
Perhaps surprisingly, Belfast vehicles last longer than others, going against the London theory of major city driving being detrimental to your car’s livelihood.
Best Average Mileage By Region (Scrapped Cars)
| Region | Average Mileage | Variance to Average |
| Belfast | 154,681 | +17% |
| Ipswich | 142,966 | +9% |
| Peterborough | 142,860 | +8% |
| Hereford | 142,122 | +8% |
| Northampton | 141,690 | +8% |
| Plymouth | 139,886 | +6% |
| Cambridge | 139,574 | +6% |
| Newport | 139,500 | +6% |
| Colchester | 139,499 | +6% |
| Lincoln | 139,397 | +6% |
Car Recycling and Salvaging Statistics
We see a lot here through Scrap Car Comparison, so we can tell you more than just the basic scrap and salvage data! We’re in a prime position to see what the current trends are in the number of cars that are written off each year as well as how many are getting recycled correctly.
We’ve also been able to see the breakdown of vehicle fuel types and how far it gets them. With EVs even more in the spotlight than ever, we decided to have a closer look for 2025.

How many electric vehicles are scrapped?
Although there has been a boom in EV sales in recent years, we are yet to see that fully transpire in the scrap statistics. While we salvaged over 150 EVs in 2025, only five ended up on the scrap pile. This isn’t unexpected however, as the first mass-market EV, the Nissan Leaf, wasn’t released to the world until 2010. Given this sits below the 17 year life expectancy we’d already not expect to see huge figures, but everyone knows that it’s taken the best part of those 15 years for the general public to really take EVs seriously.
What we did see, however, is that hybrid vehicles last on average over twice as long as petrol-powered vehicles and cover over 80,000 more miles than one with a diesel engine.
| Fuel Type | Average Mileage |
| HYBRID | 238,825 |
| DIESEL | 156,292 |
| PETROL | 114,447 |
Matt Clamp adds: “The emerging data from the scrap industry reinforces a broader trend belief that electrified powertrains are demonstrating strong durability. The growing wave of EVs sold in the past decade are yet to reach their end-of-life phase, so the next five to ten years will be crucial as the earliest high-volume EVs start to filter through the recycling system. This will provide a much clearer picture of long-term reliablity and end-of-life batteries.”
How much of a scrap car is recycled?
The good news here is that almost every part of your car has the potential to be recycled – It’s by no means just the metal. Throughout the process, the different materials will be separated so that they can be recycled in their own way, essentially using the same process that you use when you recycle your bottles and boxes at home. Glass, fabrics, (some) plastics and, of course, metal can all be isolated during the recycling process and will be repurposed and reused again, either in the automotive industry or in an entirely new field.
 Car Scrapping Knowledge Hub
Everything you needed to know about scrapping an old, written by the experts. Get step by step guidance to everything from payment, collection and paperwork.
Value your scrap car
Calculate the scrap value of your car. Get an instant price online and learn how to get the most value.
How to scrap a car
Find out the exact documents and paperwork you’ll need, how to scrap a car and how to get the best price.
Scrap without a log book
Why is the V5C log book so useful when scrapping your car? And can you still scrap a vehicle if you don’t have one? Find out with this guide.
DVLA scrapped car
How to notify the DVLA when you scrap your car – plus everything else you mustn’t forget! Here’s our simple online guide.
Or, visit our Car Scrapping Knowledge Hub for guides on all topics related to scrapping and recycling an old car

Scrap a Car in Your Area
Scrapping an old car doesn’t have to be stressful. Scrap Car Comparison can get you a great price and quick, free collection. Get an instant quote now or browse our scrap locations.